Show reports in a browser
DocWright.Reporting.Viewer turns a paginated report into HTML with inline SVG for the browser, plus a region map: JSON describing every item's position, links, toggles and text, for your viewer to bind behaviour to. It reads the same page model as the PDF, so the preview and the export can't disagree.
dotnet add package DocWright.Reporting.Viewer
Render to HTML
Process the report as in the SSRS tutorial, then:
using DocWright.Reporting.Pagination;
using DocWright.Reporting.Viewer;

// Soft pages for the screen: the report's InteractiveHeight, no margins.
ReportPageModel pages = ReportPaginator.Paginate(instance, fonts,
    new ReportPaginationOptions { Mode = ReportPaginationMode.Interactive });

ReportHtmlProjection projection = ReportHtmlRenderer.Project(pages, new ReportHtmlOptions
{
    Output = ReportHtmlOutput.Document,   // a whole HTML page; Fragment to embed in yours
});

File.WriteAllText("regional-sales.html", projection.Html);
File.WriteAllText("regional-sales-regions.json", projection.RegionMap.ToJson());

ReportRegionPage first = projection.RegionMap.Pages[0];
Console.WriteLine($"{projection.RegionMap.Pages.Count} page(s); page 1 has {first.Regions.Count} regions");
Output
1 page(s); page 1 has 20 regions
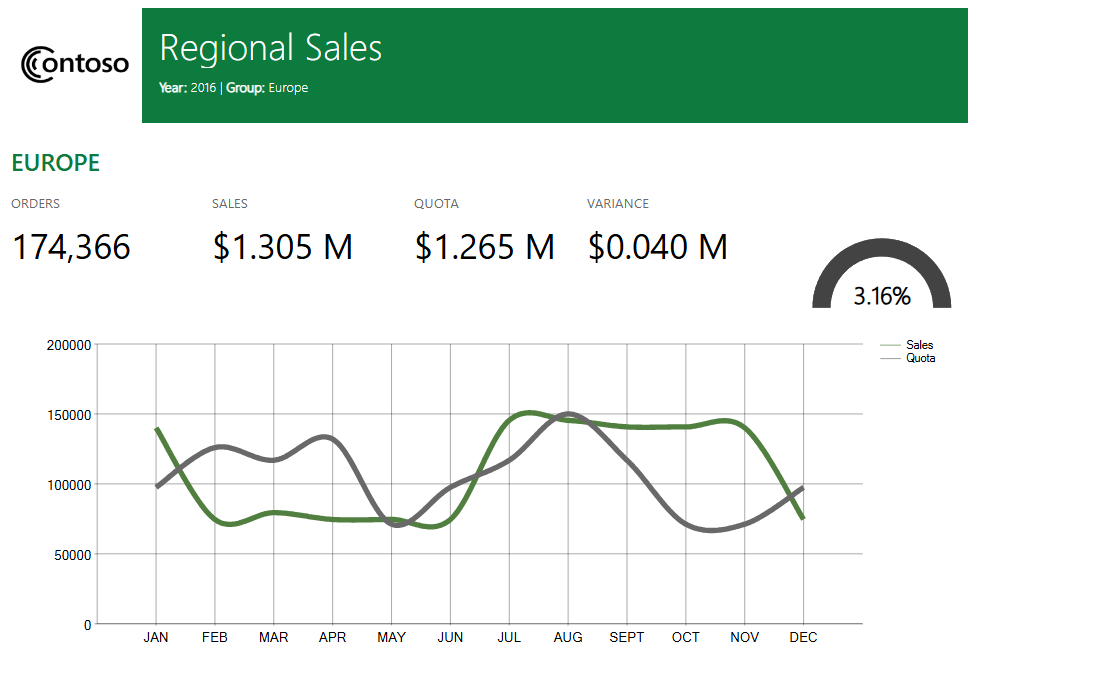
How it is drawn
| Part | Markup | Why |
|---|---|---|
| Item boxes and backgrounds | Absolutely positioned <div>s, in points |
Exact positioning |
| Borders | One <div> per edge, centred on the edge |
Matches the PDF, where CSS borders sit inside or outside the box |
| Text | <svg><text> at the measured baseline |
Text lands where the PDF puts it, whatever fonts the browser has |
| Charts, gauges, barcodes | One <svg> per item |
Drawn by the same shapes as the PDF |
| Images | <img> with a data: URL, clipped |
Output = ReportHtmlOutput.Fragment (the default) returns markup to embed in your own page. Include projection.StyleSheet once. projection.Pages gives the markup one page at a time, for streaming.
Pagination for the screen
ReportPaginationMode.Interactive uses the report's InteractiveHeight and InteractiveWidth, with no margins, and never cuts a page sideways. Page breaks, repeated headers and page numbers follow the same rules as print, from the same paginator.
Safe to show untrusted reports
A report's text, tooltips and URLs are evaluated expressions written by someone else, so the HTML:
- escapes every value, and drops control characters;
- contains no script and no event handlers, ever;
- writes links only for
http,https,mailtoor relative URLs.javascript:anddata:links are refused (DXP9501) and left out. They are still in the region map, markedIsNavigable = false, if your own policy wants them; - embeds only raster images, never SVG documents, which can carry script (
DXP9503).
The region map
projection.RegionMap lists each page's regions with their position (integer twips from the page's top-left), text, Actions (hyperlinks, bookmark links, drill-throughs), Toggle and UserSort. ToJson() writes it deterministically. A viewer uses it for clicks and search instead of reading the markup back.
Viewer services
The viewer package also has the services behind an interactive viewer: hit-testing (what is at this point), action resolution (where this link goes), search across pages, and toggling and sorting with re-pagination of only the pages affected. Toggle state lives in ReportPaginationOptions.ToggledItems, so the server re-paginates the same processed report without running its queries again.