Embed the designer
The designer is the ReportDesigner component over a ReportDesignerBackend. The backend lists, loads and saves reports and answers the data pane's questions (fields, sample rows); the viewer backend it wraps gives the designer its live preview.
The backend
LocalReportDesignerBackend takes the viewer backend and three delegates: list the store, load a report's bytes, save a report's bytes. The ReportWright.Samples.Embed sample keeps a folder of .rdl files:
using ReportWright.Blazor.Designer;

var designer = new LocalReportDesignerBackend(
    viewerBackend,
    _ => Task.FromResult<IReadOnlyList<string>>(Directory.GetFiles(reportsDirectory, "*.rdl").Select(Path.GetFileName).ToList()),
    (path, _) => Task.FromResult(File.ReadAllBytes(Path.Combine(reportsDirectory, Path.GetFileName(path)))),
    (path, bytes, _) => { File.WriteAllBytes(Path.Combine(reportsDirectory, Path.GetFileName(path)), bytes); return Task.CompletedTask; });

builder.Services.AddSingleton<ReportDesignerBackend>(designer);
With the REST API, HttpReportDesignerBackend does the same over GET /reports, GET|PUT /reports/definition/{path} and POST /design/schema/{dataSet}; the host's ReportPermissions decides who may save.
The page
@page "/designer/{*Path}"
@using ReportWright.Blazor.Designer

<ReportDesigner Path="@Path" />

@code {
    [Parameter] public string? Path { get; set; }
}
Without a Path the designer opens a blank 2016 report. Saved fires with the path after a successful save; ShowToolbar, Theme, CssClass and Strings work as on the viewer.
What a user gets
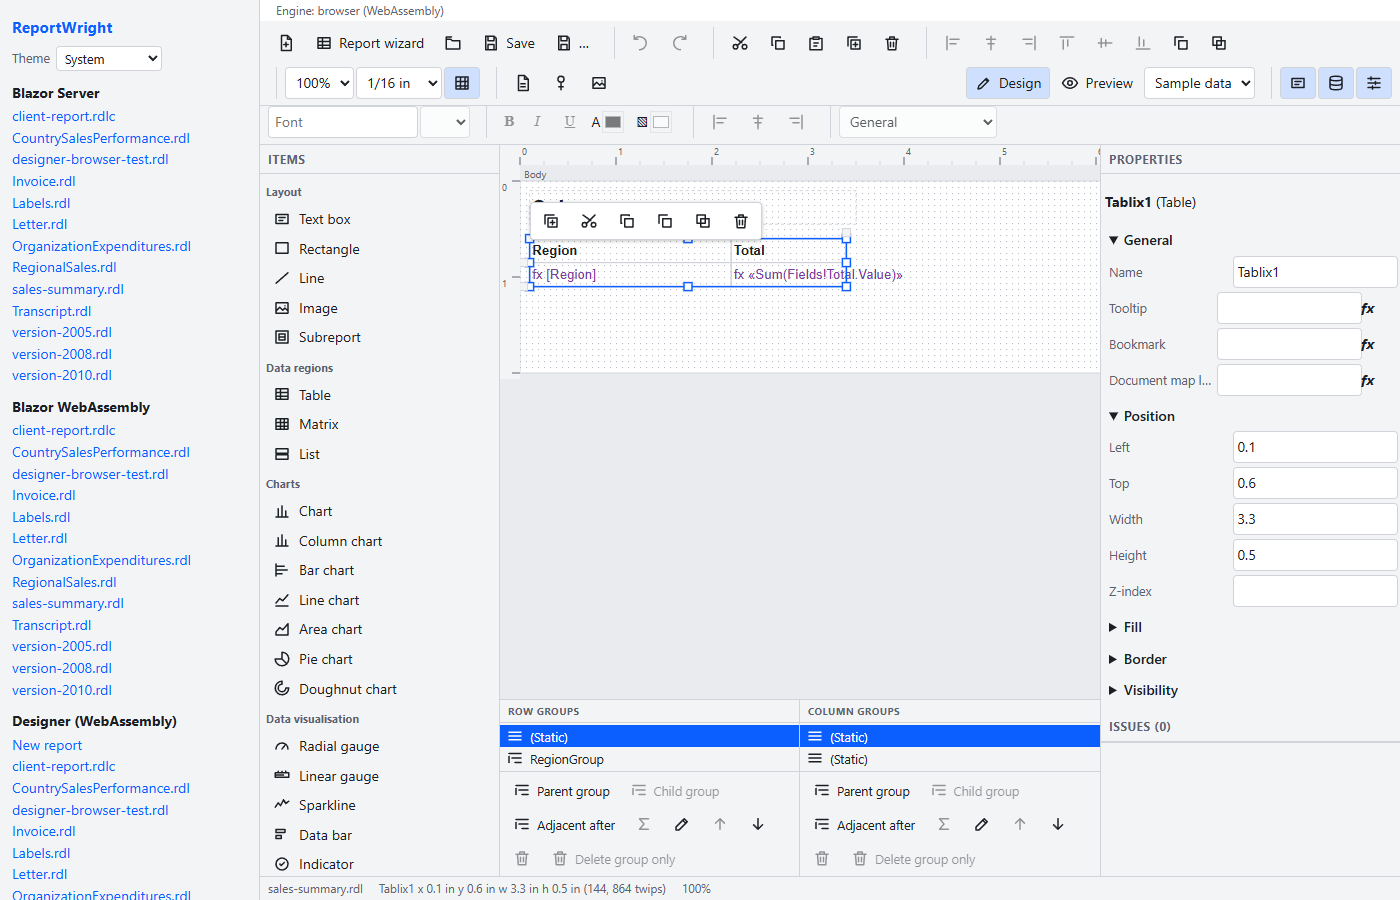
- A design surface with rulers, a snap grid (1/16 in, 1/8 in or off), zoom presets, smart guides, eight resize handles, a rubber band, a floating toolbar and the keyboard shortcuts of Report Builder.
- The palette: textbox, rectangle, line, image, subreport; table, matrix, list; column, bar, line and area charts; sparkline, data bar, radial and linear gauges, indicator, barcode, QR code, map. An entry the pinned engine cannot draw is shown disabled with the reason.
- Tables and matrices edited in place: a second click reaches a cell, Tab and the arrows move, the cell toolbar inserts and deletes rows and columns, merges and splits, and lane grips resize; the grouping pane under the surface adds, nests, moves and deletes groups; the group dialog edits expressions, sorting, filters, page breaks and visibility.
- Charts and gauges bound by dropping fields: a numeric field adds a series, a text field sets the category; the Data dialog edits type, series, scale and icon set.
- A property grid generated from the schema, an expression editor with the engine's function catalogue and its parse diagnostics, parameter, page setup and image dialogs, and a preview tab on invented or real data.
- A data pane that adds, edits and removes data sources and datasets (query, fields, calculated fields, query parameters, filters, a connection test and a preview of the first rows), and lists the parameters and the built-in fields (page number, total pages, execution time, user) to drag onto the page.
- A report wizard (a grouped table with totals, a matrix or a chart in four steps), a query designer over the source's tables and foreign keys, and shared data sources a report references by name.
- A formatting toolbar (font, size, bold, italic, underline, colours, alignment, number format) for the selected textboxes or cells, a click action on textboxes and images (go to a URL, a bookmark or another report), and the report's own properties when nothing is selected (description, author, language, default font, variables, custom code).
- Undo and redo of everything, one entry per gesture, and a file that keeps whatever the designer does not understand.
The invented data follows each field's declared type (rd:TypeName): a field without one is text, so a Sum over it previews as #Error. The data pane's refresh button fills in the types from the host's discovery, without changing a type the report already declares, as one undo step.
The designer guide has the rules in full.