The designer
The designer is a Blazor component over a command layer. Every change a user makes is a reversible command on the report's own element tree, coalesced per gesture into one undo entry, so a file keeps everything the designer does not understand and nothing is ever silently dropped.
The surface
- Coordinates are integer twips; one CSS pixel is 15 twips at 100 % zoom. Snap is 1/16 in by default, 1/8 in or off; zoom presets run 50 % to 150 %.
- Selection has three states: nothing, one or more items, or one cell in a data region. A click selects, Shift-click toggles, a rubber band from empty canvas selects what it touches. Resize handles appear for a single item.
- Gestures preview without mutating and commit one entry on release: move with grid snapping and smart guides, resize pinned to the opposite edge, a click that moved nothing commits nothing. Right-click or a long press opens the floating toolbar; keyboard shortcuts match Report Builder (arrows nudge, Ctrl+arrows fine-nudge, Delete, Ctrl+Z/Y, Ctrl+X/C/V, Ctrl+D, Ctrl+A, F2, F5).
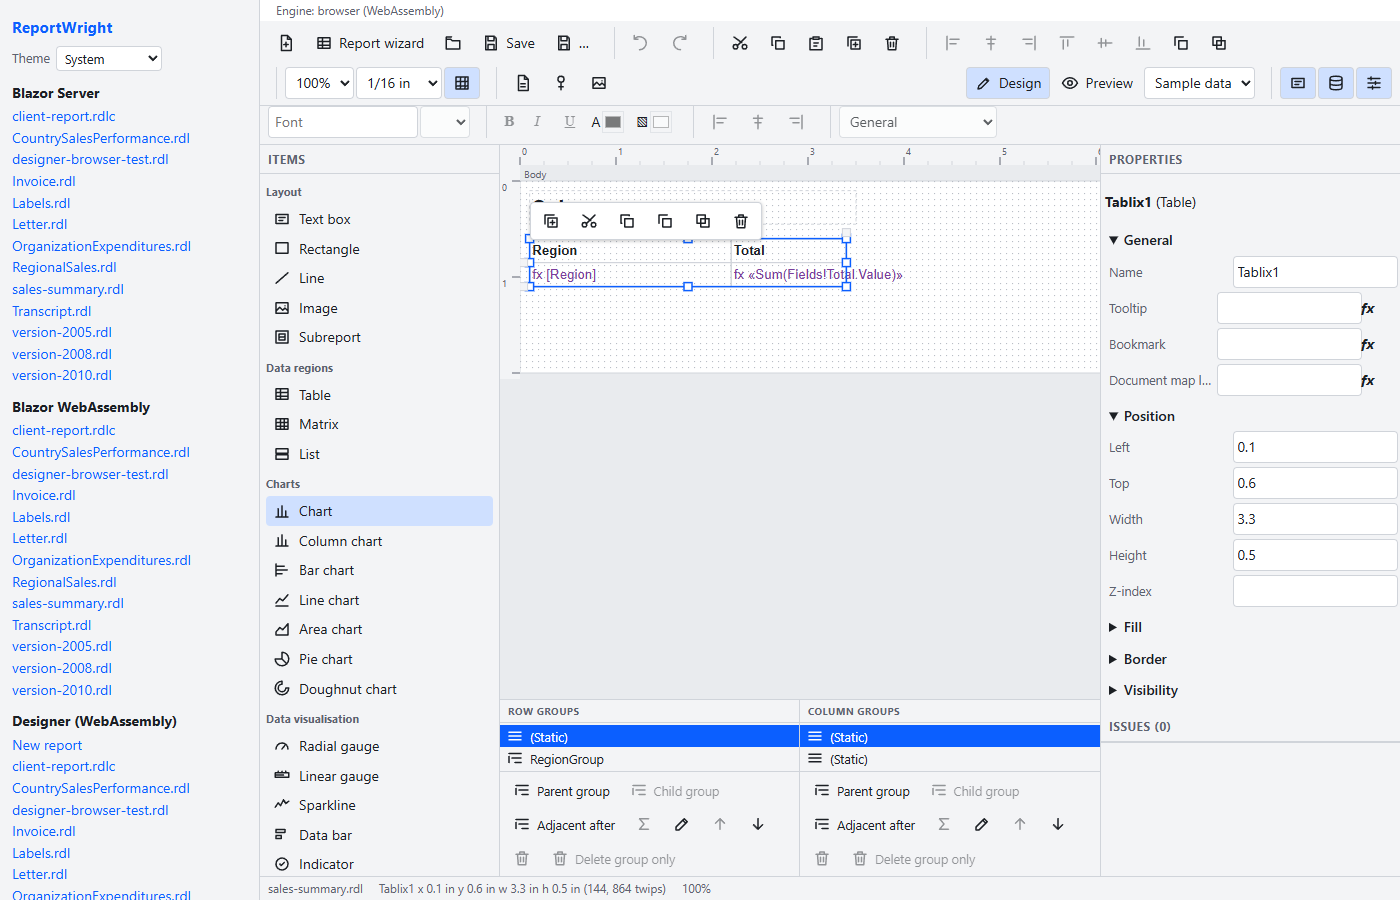
- The palette is generated from the item registry; an entry the pinned engine cannot draw is disabled with the reason in its tooltip. Click to arm then click to place, or drag onto the surface.
- A band grows to contain an item placed, moved or resized past its bottom edge, and never shrinks on its own.
Tables, matrices and lists
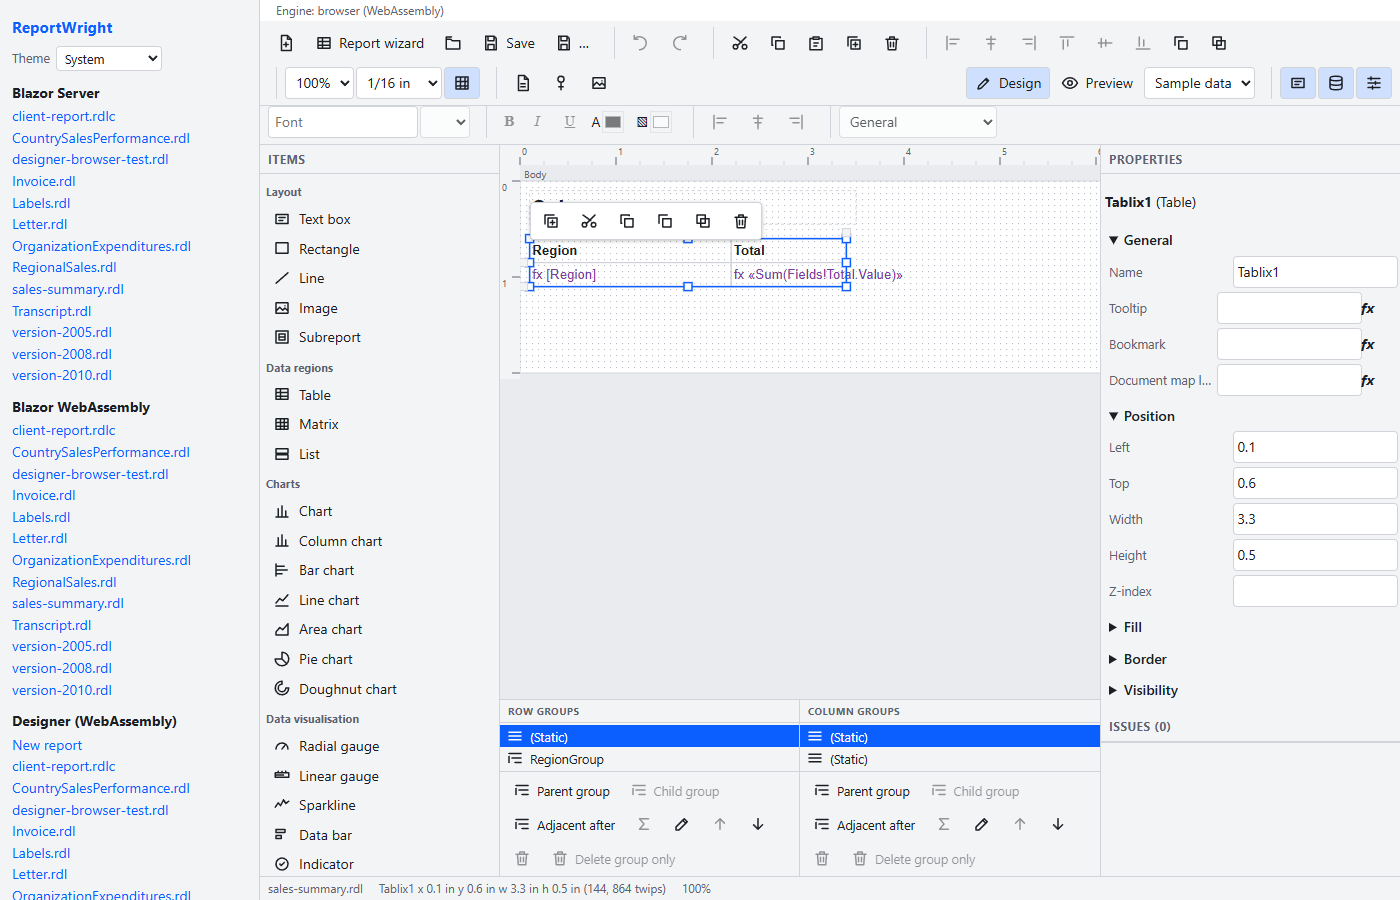
All three are a Tablix, built the way Report Builder builds them and proven against Microsoft's engine. A second click inside a selected table reaches a cell; Shift extends to a range; Tab and the arrows move; the cell toolbar inserts and deletes rows and columns, merges a range and splits a span; grips on every column and row resize them. The grouping pane under the surface lists Row Groups and Column Groups: parent, child and adjacent groups, totals, move, delete with or without the rows. The group dialog edits expressions, sorting, filters, page breaks, visibility with a toggle item, repeat and keep flags and the document map label. A field dropped on a cell binds it and labels the header above when that is empty.
Charts, gauges, indicators, barcodes
Every kind the pinned engine draws places from the palette, charts, gauges and barcodes bound to the first text and numeric fields (maps place too since 1.1.0; see Maps). A numeric field dropped on a chart adds a series; a text field sets the category; on a gauge or indicator it becomes the value; on a barcode, the value. The Data dialog edits chart type and subtype, the series, a gauge's value and scale and an indicator's icon set; the property grid has title, palette, legend, axes, minimum and maximum, pointer cap, symbology and error correction. Pie and doughnut charts are written as RDL's Shape series, as Report Builder writes them.
Data sources and datasets
The data pane is Report Builder's Report Data pane. A data source is a name and a provider kind, nothing more: the connection string and the credentials live in the host's DataSourceResolver, so the new-data-source dialog offers the connections the host lists (DataSourceResolver.Available, names, kinds and descriptions only) and writes an empty connect string. The dataset dialog edits the data source and query (a URL, SQL text or a file name, as the provider reads it), the timeout, the fields (refreshed from the source, added by column or as a calculated expression), the query parameters (@Region in SQL, {Region} in a REST URL) and the filters, with a connection test and a preview of the first rows. Both dialogs work on a copy, so the test and the preview see the query as typed; OK applies it as one undo step. A rename follows every reference, data regions and scope arguments such as Sum(x, "Sales") included; deleting a data source or a dataset that something still reads is refused with the names of what reads it.
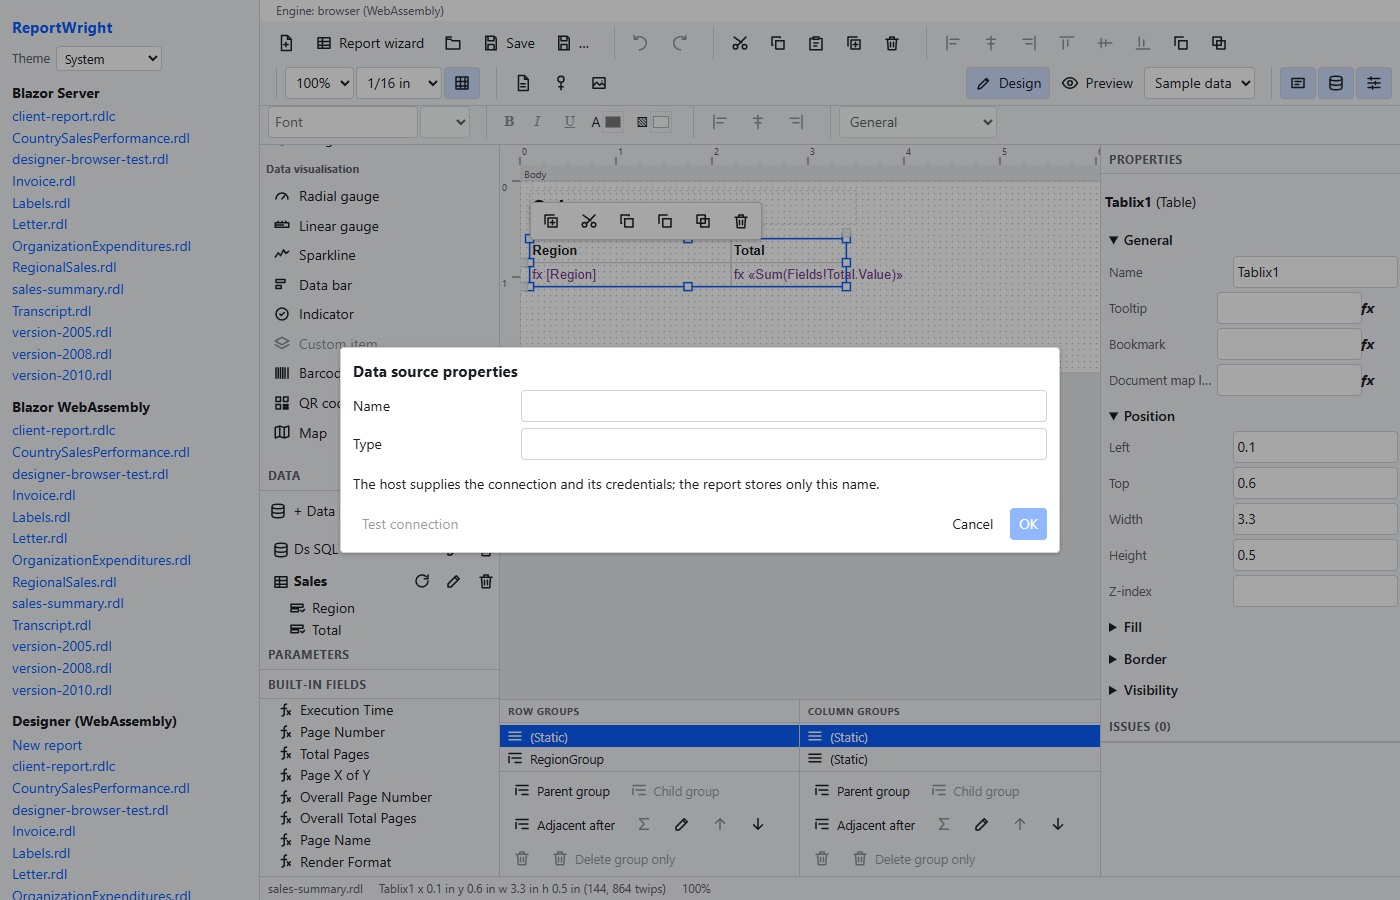
The host answers the dialogs through ReportDesignerBackend.GetDataSourcesAsync, TestDataSourceAsync and PreviewDataSetAsync: over the REST API (/design/datasources, /design/test/{dataSource}, /design/preview/{dataSet}, each for users who may edit), in a Blazor Server application through AddReportWrightComponents, or in process through LocalReportDesignerBackend.Metadata and Resolver.
The query designer
For a source whose provider can describe itself (SQL Server; a CSV folder lists its files), the dataset dialog's Query designer shows the tables and views, joins a second table by its foreign key (or a join you add), selects columns with Sum, Count, Avg, Min or Max (and the GROUP BY they need), filters with a value or an @parameter, sorts and limits with TOP, and shows the query it writes. Every name is bracketed and every typed value quoted, so nothing typed becomes SQL. Applying binds each @parameter to a report parameter of the same name, which is created when the report has none. A provider describes itself by overriding DataSourceProvider.DescribeCatalog; the host serves it at /design/catalog/{dataSource}.
Shared data sources
A data source can reference a shared one instead of holding its own: the report keeps <DataSourceReference> with the shared name, as a Reporting Services report does. The host registers shared data sources with StaticDataSourceResolver.AddShared(name, source), or loads a folder of Reporting Services .rsds and .rds files with AddSharedFolder(folder); a reference resolves by the bare name or by a server path ending in it (/Data Sources/SalesDb). The new-data-source dialog lists them marked as shared.
The report wizard
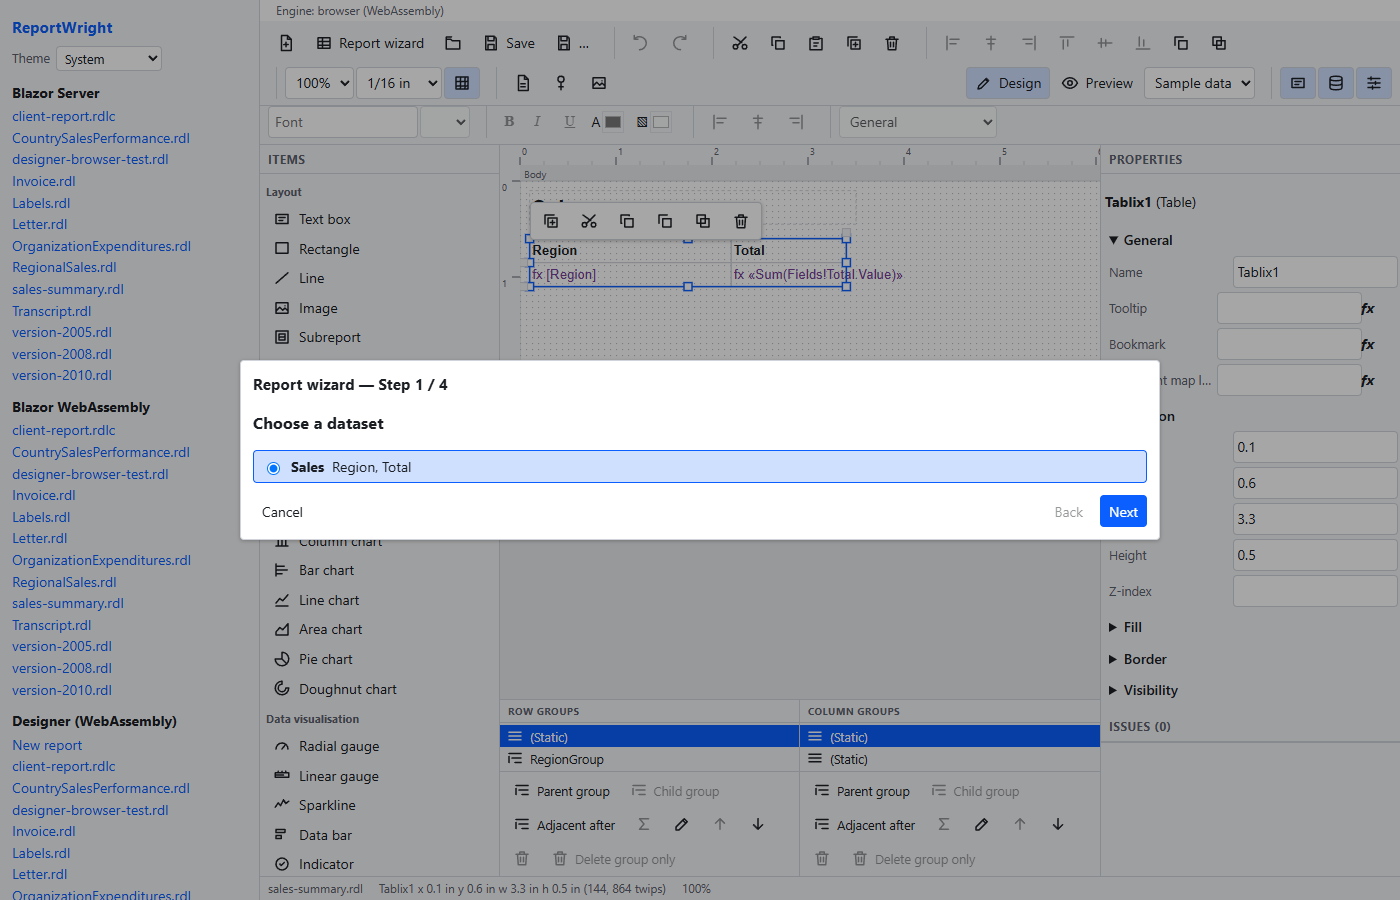
Report wizard on the toolbar builds a table, matrix or chart in four steps: a dataset, a layout, the fields, and options. A table takes detail columns and row groups, each group with a header row showing its value and an optional subtotal, and an optional grand total; a matrix crosses a row group and a column group over a summed value with totals; a chart takes a type, a category and value series. Numbers are formatted (#,0.00, or #,0 for whole numbers), a title can go above, and the result lands below whatever the body holds, as one undo step.
Maps
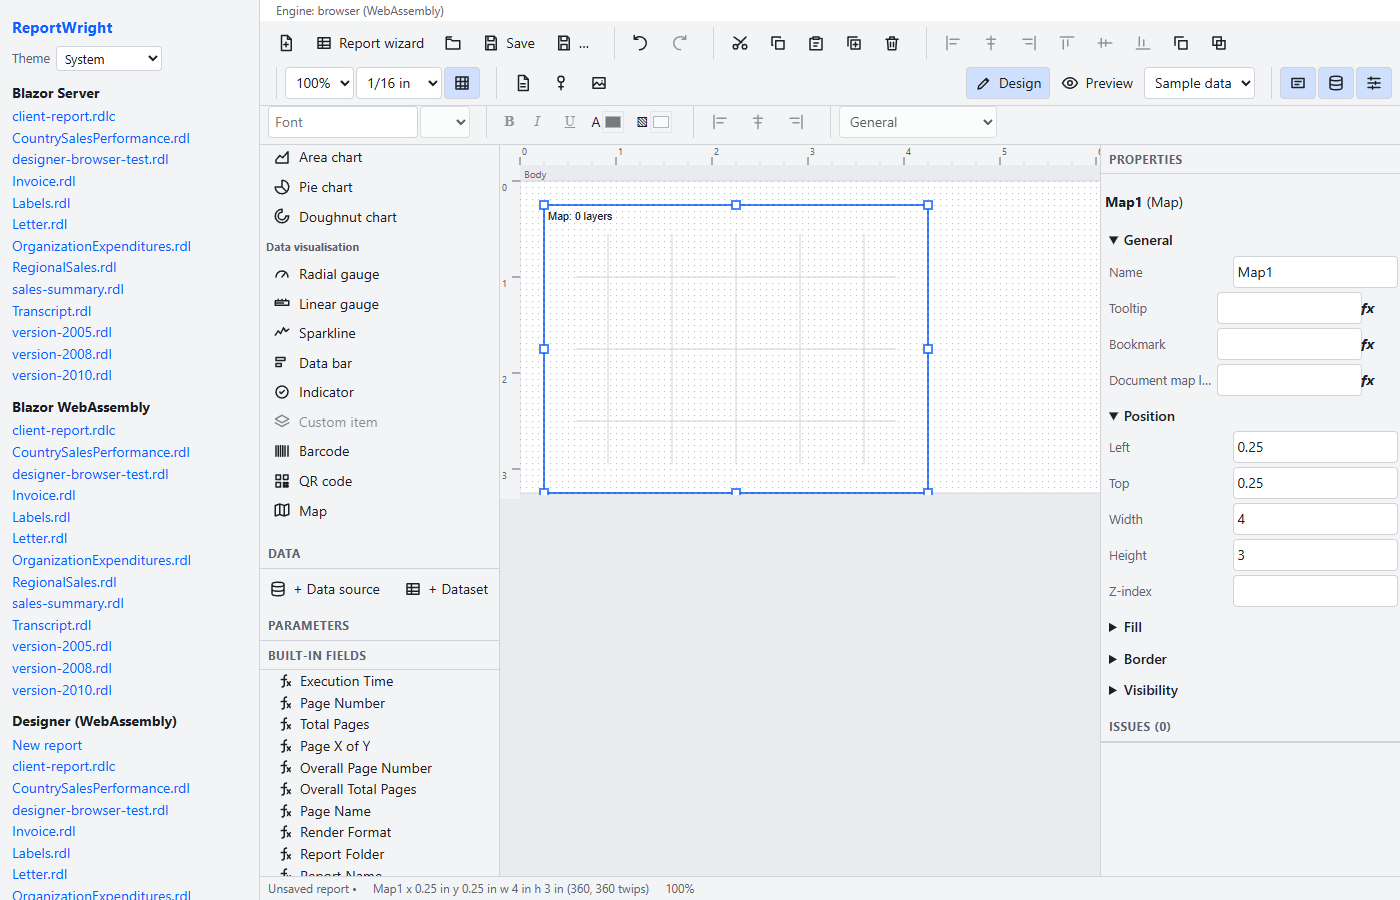
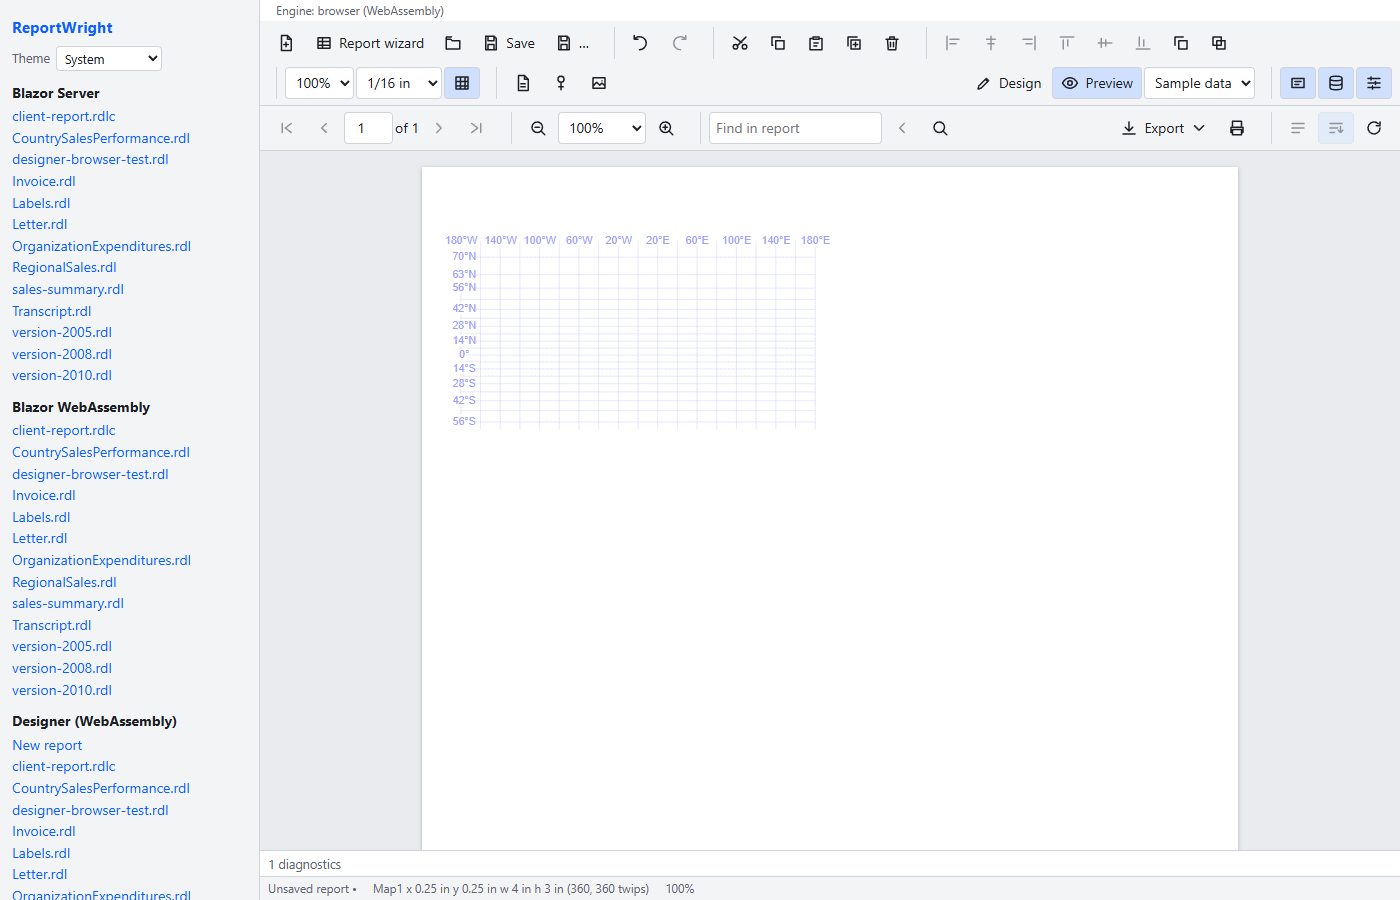
Map in the palette places a map that DocWright 1.4.0 draws: a new one is a world in Mercator with the default grid of meridians and parallels. Its layers, spatial data and colour rules are edited in the XML view or the property grid; the preview draws it with the same engine as the viewer, and names in its diagnostics anything the engine does not draw yet (legends, the colour scale, the Optimal distribution beyond three buckets). See DocWright's Maps in reports for what a map can hold.
Formatting and actions
The formatting toolbar acts on the selected textboxes, the selected cell or a range of cells: font, size, bold (Ctrl+B), italic (Ctrl+I), underline (Ctrl+U), text and background colour, alignment and a number format. From RDL 2008 the font, colour and format are written on every text run and the alignment on every paragraph, which is where the engine reads them; in an RDL 2005 file they go on the textbox. A textbox or an image takes a click action in the property grid: go to a URL, to a bookmark, or to another report with parameters (drillthrough).
Report properties
With nothing selected the property grid shows the report itself: description, author, language (a culture such as en-US, or an expression), auto-refresh, default font, report variables and custom code. Custom code runs only through the host's ReportCodeHost; without one the engine reports the call instead of running it. A property the file's schema version does not have is not offered.
Properties and expressions
The property grid is generated from a catalogue checked against the RDL schema; every expression-valued property has an fx toggle that opens the expression editor, which lists the engine's functions with signatures and shows the engine's own parse diagnostics with their positions. A cell's grid shows its lane sizes and its textbox's font, fill, border, alignment, padding, format and interactive sort.
Saving
A report is saved in the schema version it was opened in; a new report is RDL 2016. The clipboard carries RDL fragments, so items copy between reports and fields the target lacks are flagged by validation rather than dropped. Validation combines the engine's ReportValidator with the designer's own rules (names, bounds, unparseable expressions, unknown fields and parameters).