Maps in reports
A Map in a report draws as a ReportPageMap: its polygons, markers and lines become the same shapes charts and gauges use, so a map reaches PDF, images, the browser viewer, Word and Excel. Every rule was measured against Microsoft's report engine.
This guide uses territories.rdl: four squares carrying a Region field, coloured by sales through a map data region and a three-bucket colour rule, a layer of shops read from a dataset, and a title.
Give the map its data
using DocWright.Reporting.Data;

var sales = new ReportDataTable()
    .AddColumn("Region", typeof(string))
    .AddColumn("Amount", typeof(double))
    .AddRow("North", 120.0)
    .AddRow("South", 40.0)
    .AddRow("East", 75.0)
    .AddRow("North", 30.0);

// A spatial field holds WKB bytes, base64 WKB or WKT text: here, WKT.
var stores = new ReportDataTable()
    .AddColumn("Store", typeof(string))
    .AddColumn("Location", typeof(string))
    .AddRow("Harbour", "POINT (5 17)")
    .AddRow("Station", "POINT (17 5)");

var provider = new ReportInMemoryDataProvider().Add("Sales", sales).Add("Stores", stores);
A layer's shapes come from embedded VectorData (base64 WKB) or, with MapSpatialDataSet, from a dataset: one shape per row, read from a field holding WKB bytes, base64 WKB or WKT text. DocWright has no SQL Server types, so a geometry column reaches it as STAsBinary() or STAsText(). The fields MapFieldNames lists become the shape's fields.
Read and draw the map
using DocWright.Fonts;
using DocWright.Reporting.Pagination;
using DocWright.Reporting.Processing;

var fonts = new FontEngine();
using ReportInstance instance = ReportProcessor.Process(definition, provider, new ReportRunOptions());
ReportPageModel pages = ReportPaginator.Paginate(instance, fonts);

ReportPageMap map = pages.Pages[0].Items.OfType<ReportPageMap>().Single();
Console.WriteLine($"{map.Name}: {map.Kind}, {map.Width.Value / 1440.0}in x {map.Height.Value / 1440.0}in, {map.Shapes.Count} shapes");
foreach (ReportShapeRegion region in map.Shapes.OfType<ReportShapeRegion>())
{
    Console.WriteLine($"  region filled #{region.Fill!.Value.R:X2}{region.Fill.Value.G:X2}{region.Fill.Value.B:X2}");
}

Console.WriteLine($"  labels: {string.Join(", ", map.Shapes.OfType<ReportShapeLabel>().Select(l => l.Text))}");
Output:
Territories: Map, 4in x 3in, 11 shapes
  region filled #FF0000
  region filled #008000
  region filled #008000
  region filled #D3D3D3
  labels: Sales by region
MaxReportMapPoints: The maps of this report read more than 10 coordinates.
using DocWright.Core.Diagnostics;
using DocWright.Core.Rendering;
using DocWright.Renderers.Pdf;

using (FileStream pdf = File.Create("territories.pdf"))
{
    new PdfLayoutRenderer(fonts).Render(pages.ToLayoutDocument(), pdf, new RenderOptions(), new CollectingConversionDiagnostics());
}
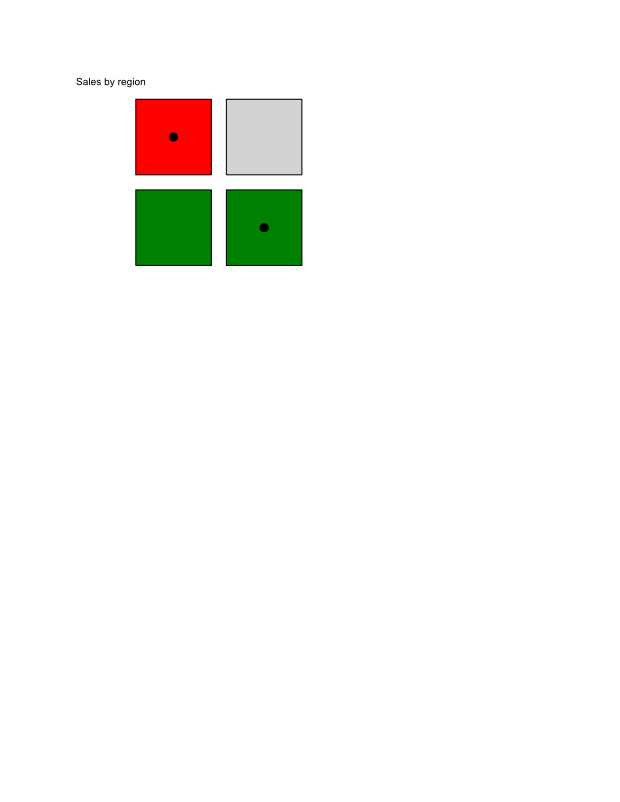
North sums to 150 and falls in the top of three equal intervals over 40–150, so it is red. South (40) and East (75) are in the first interval. West has no data, so no group binds it and it keeps its template's grey.
- Coordinates:
Planarmaps draw their data as given.Geographicmaps project longitude and latitude with the named projection:Equirectangular,Mercator,Robinson,Fahey,Eckert1,Eckert3,Wagner3,HammerAitoff(drawn as Hammer's, as the reference does) andBonne(drawn as sinusoidal, as the reference does). - Binding: a layer that names a
MapDataRegionmatches each group to the shapes whose fields equal itsMapBindingFieldPairs. - Rules: colour range rules (
EqualInterval,EqualDistribution,Custombuckets), custom colour rules, and theBrightPastel,Light,SemiTransparentandPacificpalettes. - Styles: fills, holes, transparency, every border style, the eight marker shapes, lines, labels, meridians and parallels with their labels, and titles.
Note
Optimal, the default distribution of a colour rule, is drawn as equal intervals: Reporting Services' rule for it has only been matched at two and three buckets. Set DistributionType explicitly when the colours must match exactly.
What a map doesn't draw
Everything a map holds that DocWright doesn't draw is named in one DXP9409 diagnostic per map, and the rest of the map draws: tile layers (the reference fetches them over the network), shapefiles, spatial data from a data region, the Optimal distribution and the Random palette (which is random in Reporting Services too), size, marker and centre-point rules, legends, the colour scale, the distance scale, border skins and custom views. A map that Reporting Services itself refuses to draw keeps its box, empty, where Reporting Services prints an error.
Limit the coordinates a report can read
using DocWright.Core;
using DocWright.Reporting.Pagination;
using DocWright.Reporting.Processing;

var bounded = new ReportRunOptions();
bounded.Limits.MaxReportMapPoints = 10;
using ReportInstance small = ReportProcessor.Process(definition, provider, bounded);
try
{
    ReportPaginator.Paginate(small, fonts);
}
catch (ResourceLimitExceededException error)
{
    Console.WriteLine($"{error.LimitName}: {error.Message}");
}
MaxReportMapPoints (ten million by default, in ReportRunOptions.Limits) counts every coordinate the maps of one pagination read, embedded or from datasets. Setting it to null doesn't remove the bound: pagination never reads more than fifty million. A map's own MaximumTotalPointCount stops it sooner and is reported rather than thrown.
Next steps
- Paginate and render a report for pages, navigation and PDF output.
- Export a report: a map draws into a picture in Word and Excel.